Flood frequency analysis: различия между версиями
(Полное создание страницы по учебнику) |
|||
| Строка 1: | Строка 1: | ||
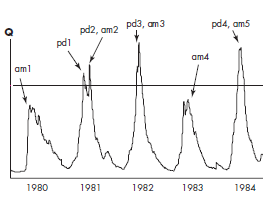
| − | [[Файл:Ffa.png|альт=|мини|270x270пкс|Figure 1. Daily flow record for the Adams river (British Columbia, Canada) during five years in the 1980s. Annual maximum series are denoted by 'am', partial duration series above the threshold line by 'pd'. /n/b In this record there are five annual maximum data points and only four partial duration points, including two from within 1981. Source: Data courtesy of Environment Canada. <ref name=":0">Davie T. Fundamentals of Hydrology, Second Edition // Management. 2008. Vol. 298, № 10.</ref>]] | + | [[Файл:Ffa.png|альт=|мини|270x270пкс|Figure 1. Daily flow record for the Adams river (British Columbia, Canada) during five years in the 1980s. Annual maximum series are denoted by 'am', partial duration series above the threshold line by 'pd'. /n/b In this record there are five annual maximum data points and only four partial duration points, including two from within 1981. Source: Data courtesy of Environment Canada. <ref name=":0">Davie T. Fundamentals of Hydrology, Second Edition // Management. 2008. Vol. 298, № 10. P. 200</ref>]] |
==Анализ частоты паводков== | ==Анализ частоты паводков== | ||
Версия 22:41, 21 декабря 2021

Анализ частоты паводков
Компонент анализа, учитывающий частоту паводков, является одним из четырех исследовательских компонентов для оценки наводнений.[2]
100-летнее наводнение
Является событием, которое имеет шанс 1 на 100 (1% вероятности) быть равным или в любом данном году.[3]
50-летний интервал повторяемости
Период повторяемости есть обратная вероятность того, что событие наступит в течение года: "50-летнее наводнение" (50-летний интервал повторяемости) имеет 0,02 или 2% вероятности наступления в течение года.[4]
Определение на английском
Flood frequency analysis is probably the most important hydrological technique. The concept of a ‘100-year flood’, or a fifty-year recurrence interval, is well established in most people’s perceptions of hydrology, although there are many misunderstandings in interpretation.
Flood frequency analysis is concerned with peak flows. There are two different ways that a peak flow can be defined:
• the single maximum peak within a year of record giving an annual maximum series; or
• any flow above a certain threshold value, giving a partial duration series.
Figure 1 shows the difference between these two data series. There are arguments for and against the use of either data series in flood frequency analysis.[1]
a ‘100-year flood’
Average Recurrence Interval is the average time period between floods of a certain size: a 100-year ARI flow will occur on average once every 100 years.[5]
a fifty-year recurrence interval
A 50-year recurrence interval event has a 1 in 50 or 2% chance of occurring in a year. [6]
Пример использования терминов на английском языке
- All flood frequency analysis is concerned with the analysis of frequency histograms and probability distributions.[1]
- In contrast, the 100-year floods have decreased in arid and temperate zones, and show mixed results in cold zones, but at a smaller sample of sites with long records.[7]
- A rainfall total of 6.60 inches in a consecutive 24-hour period is said to have a 50-year recurrence interval.[8]
Перевод использований на русском языке
- Весь анализ частоты паводков связан с анализом гистограмм частот и распределений вероятностей.
- Напротив, 100-летние паводки уменьшились в засушливых и умеренных зонах и показывают смешанные результаты в холодных зонах, но в меньшей выборке участков с длительными записями.
- Считается, что общее количество осадков 6,60 дюйма за последовательный 24-часовой период имеет 50-летний интервал повторяемости.
Список литературы
- ↑ 1,0 1,1 1,2 Davie T. Fundamentals of Hydrology, Second Edition // Management. 2008. Vol. 298, № 10. P. 200
- ↑ Доклад Генерального директора о выполнении Плана действий ЮНЕСКО в поддержку сводного плана действий Африканского союза в области науки и технологии //Конференция: ЮНЕСКО. Исполнительный совет, 182nd. 2009
- ↑ 100-летний поток // ru.knowledgr.com [Электронный ресурс]. Режим доступа: https://ru.knowledgr.com/00048243/100%D0%BB%D0%B5%D1%82%D0%BD%D0%B5%D0%B5%D0%9D%D0%B0%D0%B2%D0%BE%D0%B4%D0%BD%D0%B5%D0%BD%D0%B8%D0%B5 (дата обращения - 21.12.2021)
- ↑ Анализ повторяемости паводков: международная версия // MetEd [Электронный ресурс]. Режим доступа:https://www.meted.ucar.edu/hydro/basic_int/flood_frequency_ru/print.php (дата обращения - 21.12.2021)
- ↑ Flood probabilities // Environment Cantenbery Regional Council [Электронный ресурс]. Режим доступа:https://www.ecan.govt.nz/your-region/your-environment/natural-hazards/floods/flood-probabilities/ (дата обращения - 21.12.2021)
- ↑ Dinicola K. The "100-Year Flood" // U.S. GEOLOGICAL SURVEY (USGS). 2005.
- ↑ Slater L. et al. Global Changes in 20-Year, 50-Year, and 100-Year River Floods // Geophys. Res. Lett. 2021. Vol. 48, № 6.
- ↑ Prepared in cooperation with the City of Charlotte and Mecklenburg County. Effects of August 1995 and July 1997 Storms in the City of Charlotte and Mecklenburg County, North Carolina // Storm Water Services. 1998.